
A practical collection of software for literature reviews, research data analysis, scientific visualization, academic writing, and reproducible research.
Research involves much more than reading papers and writing a manuscript. A typical research project may require searching through hundreds of publications, managing references, cleaning experimental data, performing statistical analysis, developing computational models, preparing scientific figures, and documenting results.
Researchers often use different software for each of these activities. Some depend on expensive commercial applications, while others spend considerable time handling tasks manually.
However, there is another option worth exploring: the growing ecosystem of free and open-source research software.
Over the years, open-source communities have developed remarkably capable tools for academic and scientific work. Many of these applications are used in universities, research laboratories, and scientific projects around the world.
This article brings together 20 such tools, organized according to the different stages of a research project. The selection deliberately goes beyond general-purpose AI chatbots and focuses on software that can become part of a researcher’s actual working environment.
Let’s explore them.
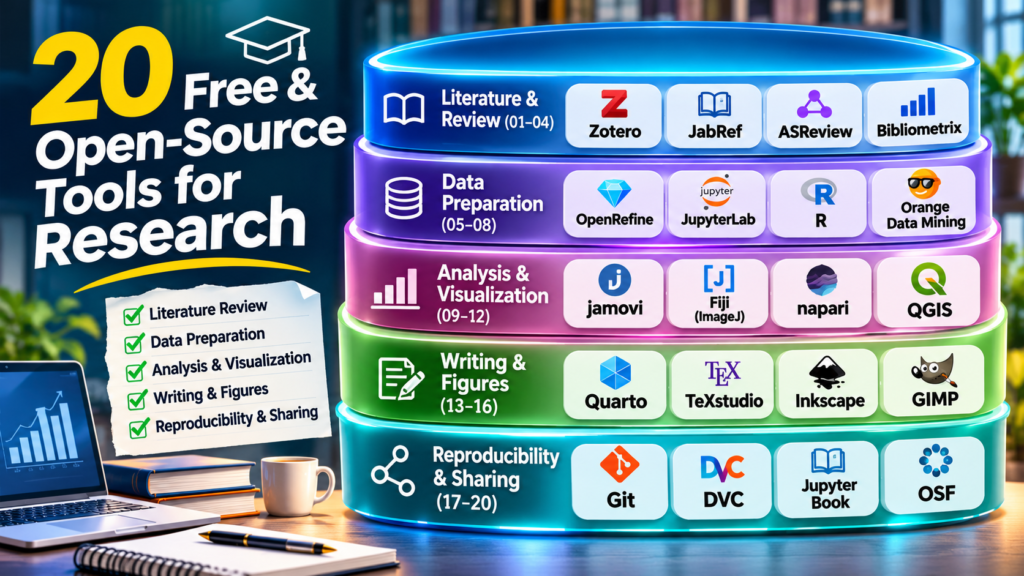
Layer 1: Literature Review and Research Discovery
Every research project begins with understanding what has already been done.
Finding relevant publications is only the first step. Researchers also need to organize references, identify research trends, screen publications, and understand relationships between different studies.
These four tools can help with that process.
1. Zotero – Manage Your Research Library
Website: https://www.zotero.org/
Anyone who has worked on a dissertation, thesis, or research paper knows how difficult reference management can become.
Zotero makes this process considerably easier.
It allows researchers to collect academic references directly from websites, organize papers into collections, attach PDFs, add notes, and generate citations in different academic styles.
One particularly useful feature is its browser connector, which can capture publication details while browsing academic databases and research websites.
Instead of maintaining references manually in spreadsheets or documents, researchers can build a searchable personal research library.
Why explore it: It is an excellent starting point for managing research publications and citations. Zotero is free and open source, although optional online storage beyond the free allowance may require payment.
2. JabRef – A Reference Manager for LaTeX Users
Website: https://www.jabref.org/
JabRef is another useful reference management application, particularly for researchers working with LaTeX.
It supports BibTeX and BibLaTeX libraries, allowing researchers to organize bibliographic information in a structured format.
It can retrieve publication metadata, identify duplicate references, organize research collections, and integrate with LaTeX writing environments.
For engineering, mathematics, physics, and computer science researchers who regularly prepare technical manuscripts, JabRef is worth considering.
Why explore it: It provides a convenient way to maintain structured bibliographies, especially in LaTeX-based research workflows.
3. ASReview – AI-Assisted Literature Screening
Website: https://asreview.ai/
Systematic literature reviews can become extremely time-consuming when researchers need to screen hundreds or thousands of publications.
ASReview approaches this problem using active learning.
Researchers begin by identifying relevant and irrelevant publications. The system learns from these decisions and prioritizes other potentially relevant papers for screening.
This does not eliminate the need for human judgment. Researchers still need to examine the publications and make the final inclusion decisions.
However, it offers an interesting way to make literature screening more efficient.
Why explore it: Particularly useful for systematic literature reviews, evidence synthesis, and large-scale publication screening.
4. Bibliometrix – Understand Research Trends
Website: https://www.bibliometrix.org/
Have you ever wanted to understand which research topics are gaining attention, which authors are working together or how a particular research field has evolved over time?
Bibliometrix can help answer these questions.
It is an R-based tool for bibliometric analysis. It supports publication analysis, citation networks, co-authorship analysis, keyword relationships and thematic mapping.
Researchers can use it to examine publication datasets and identify patterns that may not be immediately visible from reading individual papers.
Why explore it: Particularly useful for bibliometric studies, research trend analysis, and mapping the development of academic fields.
Layer 2: Research Data Preparation and Computational Work
Once the literature review is complete, the next challenge often involves working with data.
Experimental observations, survey responses, sensor readings, simulation results, and publicly available datasets rarely arrive in a perfectly organized format.
Data cleaning and computational analysis are essential parts of the research process.
5. OpenRefine – Clean and Transform Research Data
Website: https://openrefine.org/
OpenRefine is a powerful tool for working with messy datasets.
Imagine collecting survey responses from 500 participants. You may discover inconsistent spellings, duplicate entries, missing values and variations in how the same information has been recorded.
OpenRefine provides tools for exploring, cleaning, transforming and reconciling such datasets.
Its clustering functionality is especially useful for identifying similar but inconsistently entered values.
Another advantage is that data processing takes place locally on your computer.
Why explore it: Useful for survey datasets, experimental records, bibliographic data and other structured research information.
6. JupyterLab – An Interactive Research Environment
Website: https://jupyter.org/
JupyterLab is one of the most useful environments for computational research.
It allows researchers to combine executable code, equations, explanatory text, tables and visualizations within an interactive workspace.
For example, an engineering researcher can load an experimental dataset, write analysis code, generate graphs and document observations in the same notebook.
It supports multiple programming languages through the Jupyter ecosystem, including Python and R.
It is also useful for maintaining a record of computational experiments.
Why explore it: An excellent environment for data science, numerical simulations, machine learning, scientific computing and computational research.
7. R – Statistical Computing and Data Analysis
Website: https://www.r-project.org/
R has been an important part of the scientific computing ecosystem for many years.
It is a free software environment designed specifically for statistical computing and graphics.
Researchers can use R for regression analysis, hypothesis testing, statistical modelling, time-series analysis, clustering and data visualization.
Its extensive package ecosystem makes it suitable for many different research disciplines.
For researchers working with quantitative datasets, R offers considerable flexibility without requiring commercial statistical software.
Why explore it: Particularly valuable for statistical research, quantitative analysis and publication-quality visualizations.
8. Orange Data Mining – Visual Machine Learning
Website: https://orangedatamining.com/
Not every researcher wants to begin by writing code.
Orange Data Mining offers a visual approach to data analysis and machine learning.
Instead of writing an entire program, users can connect visual components called widgets to construct analytical workflows.
These workflows can include data loading, preprocessing, classification, clustering, visualization and model evaluation.
For example, a researcher could load a dataset, explore its distributions, train a classification model and compare its performance using a connected workflow.
Orange also provides extensions for specialized applications.
Why explore it: Useful for exploratory data analysis, machine learning experimentation and researchers who prefer visual workflows.
Layer 3: Statistical Analysis and Scientific Visualization
Research data becomes meaningful when it is interpreted correctly.
Statistical analysis helps researchers evaluate hypotheses, while scientific visualization makes complex observations easier to understand.
The following tools cover different types of analytical work.
9. jamovi – Statistical Analysis Without Coding
Website: https://www.jamovi.org/
jamovi is a free and open-source statistical analysis application with a spreadsheet-style interface.
It provides access to several common statistical methods, including descriptive statistics, correlation, regression, t-tests and ANOVA.
Researchers can perform analyses through a graphical interface without having to write statistical code.
An interesting aspect is that jamovi is powered by R. It can also expose the underlying R syntax associated with analyses.
This makes it useful for learning statistics as well as performing research analysis.
Why explore it: A practical option for education research, psychology, social sciences and experimental studies.
10. Fiji (ImageJ) – Scientific Image Processing
Website: https://imagej.net/software/fiji/
Image analysis plays an important role in many scientific disciplines.
Researchers working with microscopy images, biological samples, material structures and laboratory images often need specialized processing and measurement capabilities.
Fiji is an image-processing distribution built around ImageJ. It includes a collection of plugins and tools designed for scientific image analysis.
It supports image measurements, filtering, segmentation, processing and quantitative analysis.
Researchers can also extend its functionality through additional plugins and scripts.
Why explore it: Particularly relevant to biomedical imaging, microscopy, materials research and scientific image analysis.
11. napari – Visualize Complex Scientific Images
Website: https://napari.org/
When working with multidimensional scientific images, conventional image viewers can become limiting.
napari is an open-source Python-based viewer designed for multidimensional image visualization.
It supports large images, multiple channels, layers, annotations and three-dimensional visualization.
Its plugin ecosystem allows researchers to extend the viewer with specialized analysis capabilities.
For example, biomedical researchers can use it to inspect microscopy datasets and work with segmentation results.
Why explore it: Useful for microscopy, biomedical imaging, volumetric data and computational image analysis.
12. QGIS – Geospatial Research and Mapping
Website: https://qgis.org/
Research involving geographical information requires specialized tools.
QGIS is a free and open-source Geographic Information System that supports mapping, spatial analysis and geospatial data processing.
It can be used to visualize geographical datasets, analyse spatial relationships, prepare maps and combine information from different geographical sources.
Its applications extend across environmental research, agriculture, urban planning, transportation and infrastructure studies.
For example, researchers studying road conditions could combine geographical information with survey observations to create spatial maps of identified problems.
Why explore it: An excellent tool for location-based research, geographical analysis and spatial visualization.
Layer 4: Research Writing and Scientific Figures
The quality of research communication matters.
A good research result must be presented clearly through a well-structured manuscript, readable graphs, accurate diagrams and appropriate technical illustrations.
These tools can help researchers prepare their work.
13. Quarto – Create Reproducible Research Documents
Website: https://quarto.org/
Quarto is an open-source scientific and technical publishing system.
It allows researchers to create reports, articles, presentations, books and websites using a combination of text, code, equations and visualizations.
It supports Python, R, Julia and other computational workflows.
One of its important advantages is reproducibility. A report can include the code used to generate tables, charts and analytical results.
This makes it particularly useful when research documents need to be updated as datasets or experiments change.
Why explore it: Useful for computational reports, research documentation, technical publications and reproducible analysis.
14. TeXstudio – Prepare Scientific Documents with LaTeX
Website: https://texstudio.org/
LaTeX remains an important document preparation system in many scientific disciplines.
TeXstudio provides an integrated writing environment for preparing LaTeX documents.
It includes syntax highlighting, reference checking, an integrated PDF viewer, citation support and other features that make technical writing more convenient.
Researchers working with complex equations, mathematical notation, tables and bibliographies may find it especially useful.
Why explore it: A strong choice for engineering, mathematics, physics and other technical publications.
15. Inkscape – Create Scientific Diagrams
Website: https://inkscape.org/
Scientific publications frequently require clear diagrams explaining system architecture, experimental arrangements, algorithms and technical processes.
Inkscape is a free and open-source vector graphics editor that can be used to create such illustrations.
It supports SVG and other graphics formats, making it useful for diagrams that need to be resized without losing image quality.
Researchers can prepare block diagrams, flowcharts, experimental layouts and technical illustrations.
Why explore it: Useful for creating publication-quality vector diagrams and scientific figures.
16. GIMP – Prepare and Edit Research Images
Website: https://www.gimp.org/
GIMP is a free and open-source image editor available across major desktop operating systems.
It provides tools for image manipulation, cropping, compositing, colour adjustment and graphic preparation.
Researchers may use it when preparing illustrations, presentation graphics and non-evidentiary visual material.
One important point: when working with scientific evidence, image processing must follow the relevant journal and institutional integrity guidelines. Image adjustments should never misrepresent experimental findings.
Why explore it: Useful for preparing research illustrations, presentations and supporting graphics.
Layer 5: Reproducibility, Documentation and Research Sharing
A research project should not become difficult to understand once the experiments are completed.
It should be possible to track changes, understand how the analysis was performed and share the materials required to examine the work.
This is where reproducibility and open-science practices become important.
17. Git – Track Changes in Research Projects
Website: https://git-scm.com/
Git is a distributed version-control system widely used in software development and computational research.
Researchers can use it to track changes in scripts, source code, documentation and project files.
Suppose you develop an algorithm and modify it several times during experimentation. Git helps maintain a history of those changes, making it easier to understand what changed and when.
It is also useful when multiple researchers collaborate on the same computational project.
Why explore it: Essential for researchers working with code, computational models and collaborative projects.
18. DVC – Manage Research Data and Experiments
Website: https://dvc.org/
Git works well for tracking code, but research projects often involve large datasets and experimental outputs.
DVC, or Data Version Control, extends version-control practices to data and machine learning workflows.
It helps researchers track dataset versions, experiment configurations and computational pipelines.
For example, if a machine learning model produces different results after changing the training dataset, DVC can help maintain a record of the data and workflow associated with each experiment.
The core DVC software is free and open source, while some associated enterprise and hosted services have separate commercial offerings.
Why explore it: Particularly useful for machine learning, data science and computational experiments.
19. Jupyter Book – Publish Computational Research Material
Website: https://jupyterbook.org/
Research knowledge is often distributed across notebooks, documents, scripts and presentations.
Jupyter Book provides a way to organize computational content into structured publications.
Researchers can create technical books and documentation containing Markdown, equations, code, outputs and visualizations.
It can be useful for documenting a complete experimental methodology or creating supplementary material for a research project.
Why explore it: Useful for research documentation, laboratory material, computational tutorials and educational resources.
20. Open Science Framework (OSF) – Organize and Share Research
Website: https://osf.io/
Research collaboration often involves managing documents, datasets, project materials and study plans across multiple contributors.
The Open Science Framework provides a platform for organizing research projects and sharing research materials.
Researchers can create project workspaces, register studies, collaborate with team members and make selected research outputs available to others.
OSF is particularly relevant to the broader open-science movement, which encourages transparency and accessibility in research.
The hosted platform is free to use, although it is important to distinguish the free service from the open-source software behind the platform.
Why explore it: Useful for collaborative projects, study registration, research organization and open-science practices.
How These Tools Can Work Together
Installing 20 applications is not the objective. The real benefit comes from selecting a small group of tools that work well together.
Consider an engineering research project involving experimental data and computational analysis.
A researcher might use:
| Research activity | Suggested tool |
|---|---|
| Collect and organize papers | Zotero |
| Screen literature | ASReview |
| Analyse publication trends | Bibliometrix |
| Clean experimental data | OpenRefine |
| Perform computational analysis | JupyterLab |
| Statistical analysis | R or jamovi |
| Machine learning experiments | Orange |
| Scientific image analysis | Fiji or napari |
| Prepare research diagrams | Inkscape |
| Write technical documents | TeXstudio or Quarto |
| Track source-code changes | Git |
| Manage dataset versions | DVC |
| Share research materials | OSF |
The exact combination will depend on the research discipline.
A researcher working in biomedical imaging may rely heavily on Fiji and napari. Someone conducting a systematic review may find Zotero, ASReview and Bibliometrix more relevant. An engineering researcher developing computational models may spend more time in JupyterLab, Git and DVC.
There is no single toolkit that works for every researcher.
A Few Things to Keep in Mind
Free software and open-source software are not always the same thing.
A tool may be free to download but still have a proprietary licence. Similarly, an open-source desktop application may offer optional paid cloud storage, hosting or enterprise services.
Before adopting any software for institutional or commercial research, check its current licence, dependencies, data-handling practices and usage conditions.
Also consider the following:
- Data privacy: Understand where your research data is stored and processed.
- Reproducibility: Maintain records of software versions, datasets and analysis settings.
- Research integrity: Verify statistical results, citations and scientific figures.
- Compatibility: Check whether a tool integrates with your existing research workflow.
- Long-term access: Keep backups of important research documents, code and datasets.
These considerations are particularly important when working with unpublished research, confidential datasets or collaborative institutional projects.
Final Thoughts
One of the most interesting developments in academic computing is that researchers no longer need to depend entirely on expensive proprietary applications to build a capable research environment.
There are mature open-source tools for managing literature, processing datasets, performing statistical analysis, creating scientific figures, writing publications and maintaining reproducible experiments.
The important thing is not to use every tool on this list. It is to identify the activities that consume the most time in your own research and find software that genuinely improves those activities.
If you are starting out, Zotero, JupyterLab, R, jamovi and Git are good places to begin. You can gradually introduce more specialized tools as your research requirements grow.
Open-source software is not simply a lower-cost alternative. It also gives researchers opportunities to inspect tools, learn from their implementation, contribute improvements and build workflows that are more transparent and reproducible.